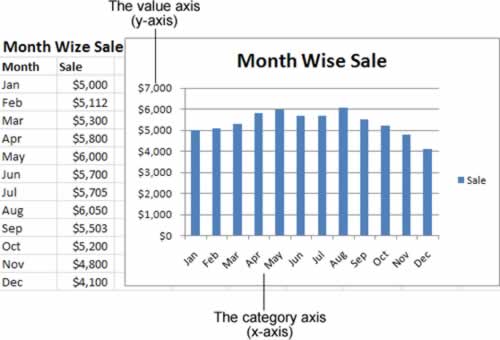
Consider all the possible variations on the simple sales chart shown in above figure. You may need to compare the sales figures but, rather than showing region-to-region comparisons, you want to show how well (or poorly) each of your firm's products sold. Or perhaps you want to chart the quarterly performance of different stores over a five-year period, or determine the relationship between sales and profitability. All these charts require a slightly different arrangement of data.
In this section, you'll get a quick introduction to all these possibilities, using just the simple column chart and line chart.
You'll learn how to customize your charts to the maximum so that they look exactly as you want. You also pick up some slick charting tricks that will make your charts even more impressive.