It is possible to have multiple fields in a pivot report.
The data in this example includes not just revenue, but also units. The CFO will probably appreciate a report by product that shows quantity sold, revenue, and average price.
When you have two or more data fields, you have a choice of placing the data fields in one of four locations. By default, Excel builds the pivot report with the data field as the innermost row field. It is often preferable to have the data field as the outermost row field or as a column field.
When a pivot table is going to have more that one data field, you have a virtual field named Data. Where you place the Data field in the .AddFields method determines which view of the data you get.
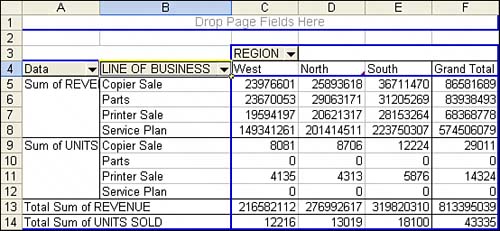
The default setup, with the data fields arranged as the innermost row field, as shown in Figure 11, would have this AddFields line:
PT.AddFields RowFields:=Array("Line of Business", "Data")
11. The default pivot table report has the multiple data fields as the innermost row field.
The view shown in Figure 12 would use this code:
PT.AddFields RowFields:=Array("Data", "Line of Business")
12. By moving the Data field to the first row field, you can obtain this view of the multiple data fields.
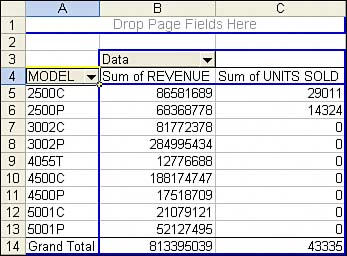
The view that you need for this report would have Data as a column field:
PT.AddFields RowFields:="Model", ColumnFields:="Data"
After adding a column field called Data, you would then go on to define two data fields:
' Set up the data fields
With PT.PivotFields("Revenue")
    .Orientation = xlDataField
    .Function = xlSum
    .Position = 1
    .NumberFormat = "#,##0"
End With

With PT.PivotFields("Units Sold")
    .Orientation = xlDataField
    .Function = xlSum
    .Position = 2
    .NumberFormat = "#,##0"
End With