A common assumption is that charting data requires a single, contiguous table. However, sometimes you may want to chart only a subset of the data in a table, and the columns you need may not be adjacent. This situation is not uncommon, but it requires some extra steps when creating your chart.
Category: Excel
Use Dynamic Named Ranges to Create Charts
Follow this tutorial if you want your charts to automatically update with new data as soon as you add it to your spreadsheet.
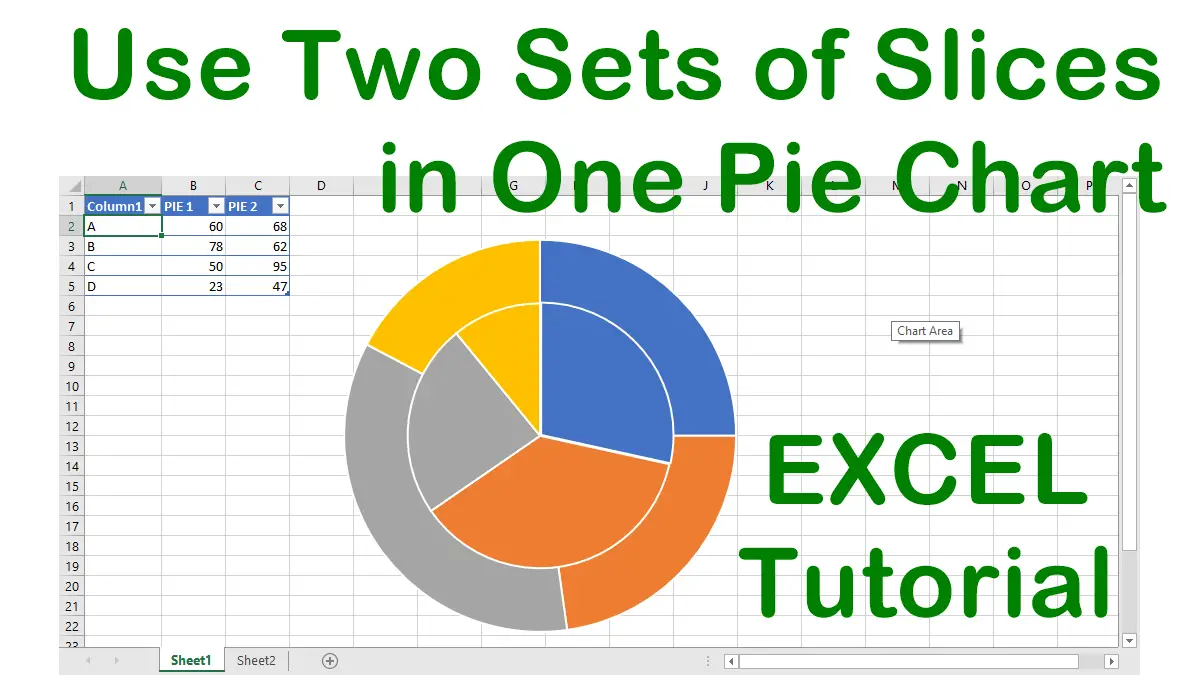
Create Two Sets of Slices in One Pie Chart

Most people think pie charts are limited to a single set of values, but here is a way to create a pie chart based on two columns of values.
Although pie charts are excellent visual aids, sometimes you want to emphasize a particular piece of the pie. Separating it from the rest gives it more attention.
Extract PivotTable Data Using GETPIVOTDATA
The GETPIVOTDATA function can be useful when you want to reference a specific value in a pivot table without using cell references, which may change if the pivot table layout changes. You can also use the function to perform calculations with pivot table data, such as summing or averaging values that meet certain criteria.
A static copy of the PivotTable is a good option when you want to share it with others but want to keep its data confidential. A static copy does not contain the underlying data that the original PivotTable uses, so you can control what the recipient can see. Another benefit of a static copy is that it has a much smaller file size than the original PivotTable, which makes it easier to send and store.
Automate PivotTable Creation
One way to create pivot tables automatically is to use the Recommended PivotTables feature. This feature scans your data and suggests some possible pivot tables that you can choose from. You can also use VBA to create pivot tables automatically. VBA gives you more control and flexibility over the pivot table creation process.
Create a PivotTable
How to quickly create a summary of your data based on the fields you choose using a PivotTable (or using a recommended PivotTable feature). You can use a PivotTable to analyze your data in different ways and find insights that might otherwise be hidden.
Explaining PivotTables
PivotTables are one of the wildest but most powerful features of Excel that may take some experimentation to figure out. When you first use a PivotTable, the process can seem a bit daunting. Some persistence is definitely necessary.
A dynamic named range that resides within another dynamic named range can be very useful for things such as long lists of names.