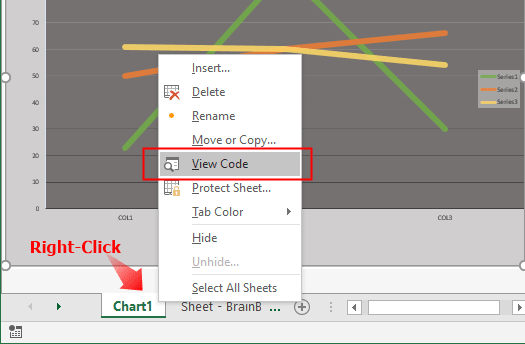
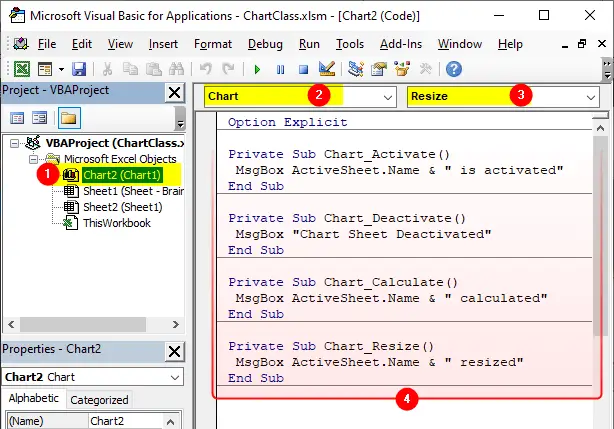
After you select View Code, you are taken directly into the VBE (Visual Basic Editor) where you can start entering the event procedure code:
Chart_BeforeRightClick
Syntax: Chart_BeforeRightClick(Cancel)
The Chart_BeforeRightClick event procedure runs when you right-click on a chart sheet. This procedure has one argument Cancel. You can disable the default right-click action from occurring by setting the Cancel to True.
Chart BeforeRightClick Event Example:
Option Explicit
Private Sub Chart_BeforeRightClick(Cancel As Boolean)
 Cancel = True
 MsgBox "Right click disabled on this chart"
End Sub
Chart_BeforeDoubleClick
Syntax: Chart_BeforeDoubleClick(ElementID, Arg1, Arg2, Cancel)
The Chart_BeforeDoubleClick event procedure runs when you double-click on a chart sheet. This procedure has four arguments:
ElementID
The part of the chart that is double-clicked, such as the chart area, plot area, wall, legend, chart title (see example)Arg1
Value dependent on theElementIDArg2
Value dependent on theElementIDCancel
SettingCanceltoTrueprevents the default double-click action from occurring.
Chart BeforeDoubleClick Event Example:
Option Explicit

Private Sub Chart_BeforeDoubleClick(ByVal ElementID As Long, ByVal Arg1 As Long, ByVal Arg2 As Long, Cancel As Boolean)

 Cancel = True

 Select Case ElementID

  Dim ArgString1 As String
  Dim ArgString2 As String

  Case xlAxis, xlAxisTitle, xlDisplayUnitLabel, xlMajorGridlines, xlMinorGridlines
   'Arg1 can be one of the following XlAxisGroup constants:
   If Arg1 = xlPrimary Then
    ArgString1 = "Primary axis "
   ElseIf Arg1 = xlSecondary Then
    ArgString1 = "Secondary axis "
   End If

   'Arg2 can be one of the following XlAxisType constants:
   If Arg2 = xlCategory Then
    ArgString2 = "displaying categories."
   ElseIf Arg2 = xlSeriesAxis Then
    ArgString2 = "displaying data series."
   ElseIf Arg2 = xlValue Then
    ArgString2 = "displaying values."
   End If

   MsgBox ArgString1 & ArgString2

  Case xlPivotChartFieldButton
   'Arg1 can be one of the following XlPivotFieldOrientation constants:
   If Arg1 = xlColumnField Then
    ArgString1 = "Column"
   ElseIf Arg1 = xlDataField Then
    ArgString1 = "Data"
   ElseIf Arg1 = xlHidden Then
    ArgString1 = "Hidden"
   ElseIf Arg1 = xlPageField Then
    ArgString1 = "Page"
   ElseIf Arg1 = xlRowField Then
    ArgString1 = "Row"
   End If

   MsgBox "PivotChart Field Button's drop zone type: " & ArgString1 & " on index " & Arg2

  Case xlDataLabel, xlSeries
   'Arg1 offset of Series collection for a specific series
   'Arg2 offset of the Points collection for a specific point
    MsgBox "Series: " & Arg1 & ", Point: " & Arg2

  Case xlTrendline
   'Arg1 offset of Series collection for a specific series
   'Arg2 offset of Trendlines collection for a specific trendline
    MsgBox "Series: " & Arg1 & ", TrendLine: " & Arg2

  Case xlPivotChartDropZone
   'Arg1 can be one of the following XlPivotFieldOrientation constants:
   If Arg1 = xlColumnField Then
    ArgString1 = "Column"
   ElseIf Arg1 = xlDataField Then
    ArgString1 = "Data"
   ElseIf Arg1 = xlHidden Then
    ArgString1 = "Hidden"
   ElseIf Arg1 = xlPageField Then
    ArgString1 = "Page"
   ElseIf Arg1 = xlRowField Then
    ArgString1 = "Row"
   End If
   MsgBox "Pivot Chart Drop Zone: " & ArgString1

  Case xlDownBars, xlDropLines, xlHiLoLines, xlRadarAxisLabels, xlSeriesLines, xlUpBars
   'Arg1 Specifies the offset within the ChartGroups collection for a specific chart group.
   MsgBox "Up Bars: arg1 only " & Arg1

  Case xlErrorBars, xlLegendEntry, xlLegendKey, xlXErrorBars, xlYErrorBars
   'Arg1 offset of Series collection for a specific series
    MsgBox "Series: " & Arg1

  Case xlShape
  'Arg1 offset of Shapes collection for a specific shape
   MsgBox "Shape: " & Arg1

  'Arg1 = None, Arg2 = None
  Case xlChartArea
   MsgBox "Chart Area"
  Case xlChartTitle
   MsgBox "Chart Title"
  Case xlCorners
   MsgBox "Corners"
  Case xlDataTable
   MsgBox "Data Table"
  Case xlFloor
   MsgBox "Floor"
  Case xlLegend
   MsgBox "Legend"
  Case xlNothing
   MsgBox "Nothing"
  Case xlPlotArea
   MsgBox "Plot Area"
  Case xlWalls
   MsgBox "Walls"
 End Select
End Sub
Chart_Select
Syntax: Chart_Select(ElementID, Arg1, Arg2)
The Chart_Select event procedure runs when a chart element is selected. This procedure has three arguments:
ElementID
The part of the chart selected, such as the legend, plot area, chart area, wall (see example)Arg1
Value dependent on theElementIDArg2
Value dependent on theElementID
Chart Select Event Example:
Option Explicit
Private Sub Chart_Select(ByVal ElementID As Long, ByVal Arg1 As Long, ByVal Arg2 As Long)
 'See above Chart_BeforeDoubleClick Example
End Sub