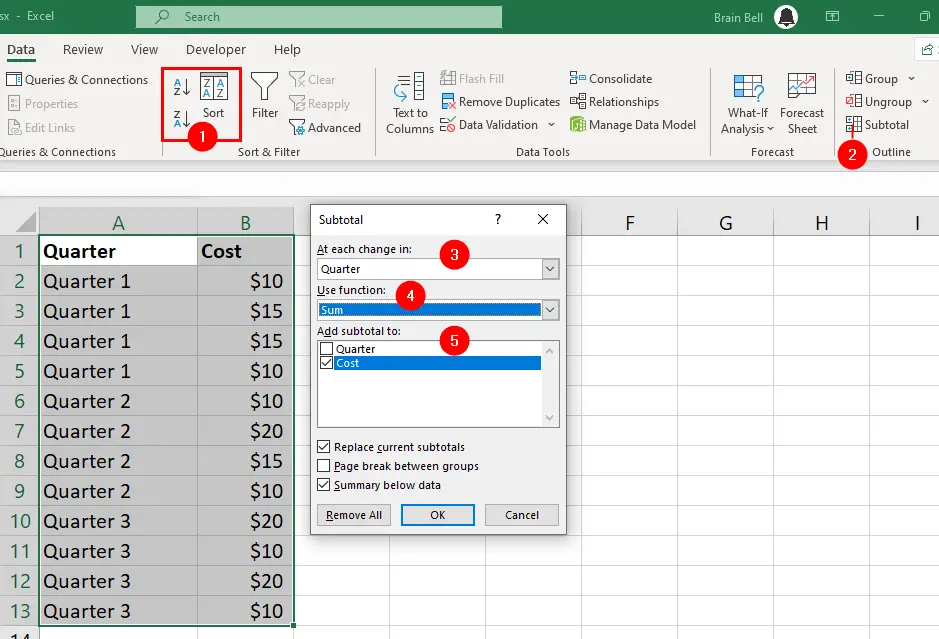
For example, if you have a sales report with data grouped by “quarter”, you can insert subtotals for each quarter to see the total “cost” amount for each one. Here are the steps to use the Subtotal feature via the Data tab:

- Sort your data by the column that you want to group by. For example, if you want to group by
Quarter, sort your data by theQuartercolumn. - Select your data range and go to the
Datatab. Click on theSubtotalicon in theOutlinegroup. - In the
Subtotaldialog box, choose the column that you want to group by from theAt each change indrop-down list. For example, chooseQuarterif you want to group by quarter. - Choose the function that you want to use to summarize your data from the
Use functiondrop-down list. For example, chooseSumif you want to sum up the cost (or choose Count, Average, Max, Min, etc.). - Select the columns that you want to apply the function to from the
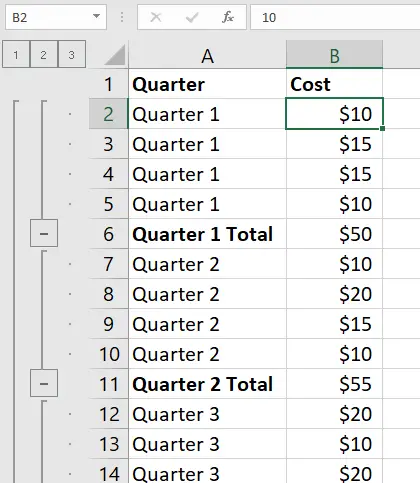
Add subtotal to list. For example, selectCostif you want to sum up that column. - Click OK. Excel will insert subtotal rows for each group of data and a grand total row at the bottom of the table.

Excel will create subtotal groups (Quarter 1 Total, Quarter 2 Total, and so on) for your data and add an outline to the left of your worksheet. You can use the outline buttons to expand or collapse the subtotal groups.
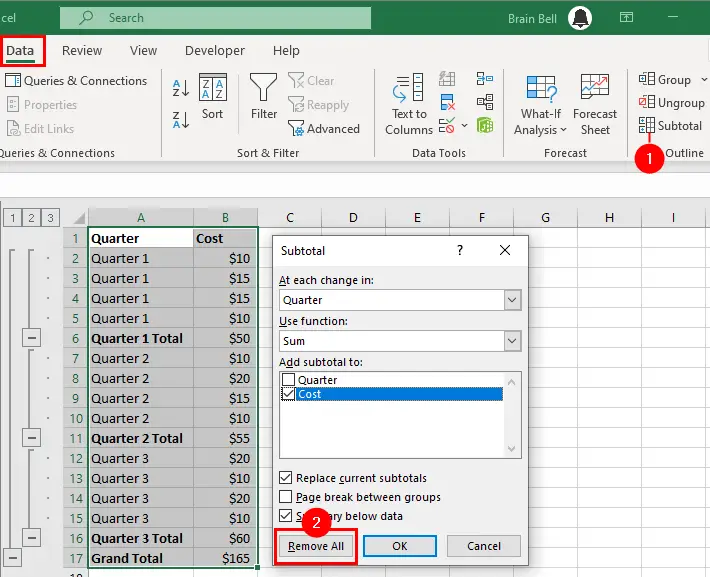
Removing Subtotals

You can also remove the subtotals by clicking on Subtotal in the Data tab and then clicking on Remove All in the Subtotal dialog box.
What is the difference between Total and Subtotal?
Subtotal in Excel performs calculations (sum, count, average, etc.) on groups of data within a table. While the Total performs calculations on the entire range of data, regardless of the groups (for example, Grand Total).
