Chart_ActivateChart_DeactivateChart_CalculateChart_ResizeChart_SeriesChangeChart_BeforeRightClickChart_BeforeDoubleClickChart_SelectChart_MouseDownChart_MouseMoveChart_MouseUp
Because there is not any code module for embedded charts, the above-mentioned procedures work only for chart sheets. To handle events for embedded charts, you need to create an object variable that represents the Chart object. See Embedded Chart Events.
How to Write Chart Sheet Events
A chart sheet contains a single chart and no cells. You can insert a chart sheet by moving an embedded chart to a separate sheet, see how to insert a chart sheet.
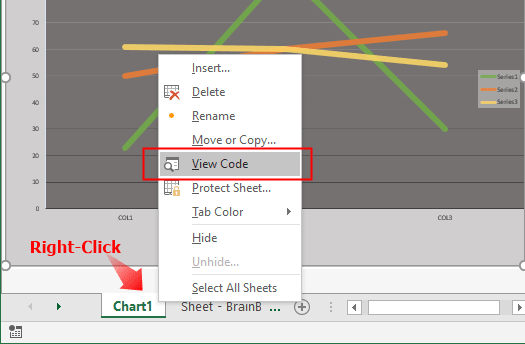
Every chart sheet has its own code module where you can write the event procedures. These procedure runs when you make any changes to the chart. To open the code module associated with a chart sheet, right-click on the Chart Sheet tab and select View Code:
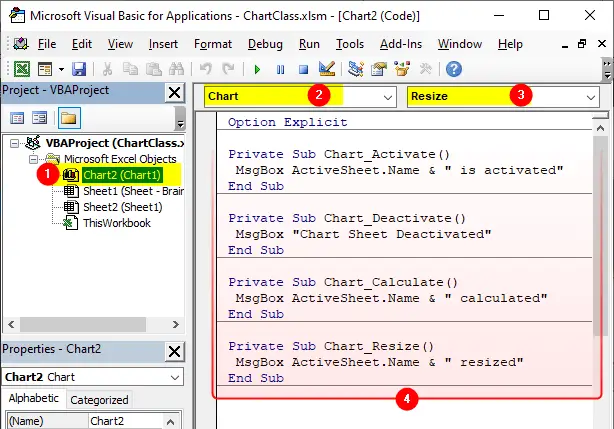
After you select View Code, you are taken directly into the VBE (Visual Basic Editor) where you can start entering the event procedure code:
How to Capture Embedded Chart Events
In Excel, when you insert a new chart it’s by default embed into the active worksheet. Because embedded charts do not have any code module, the events are not as readily available as those of chart sheets or worksheets. To make them available you need to add an object variable in ThisWorkbook code module that represents the Chart object, as described here:
- Open VBE (press
Alt+F11) - Enter the following code in
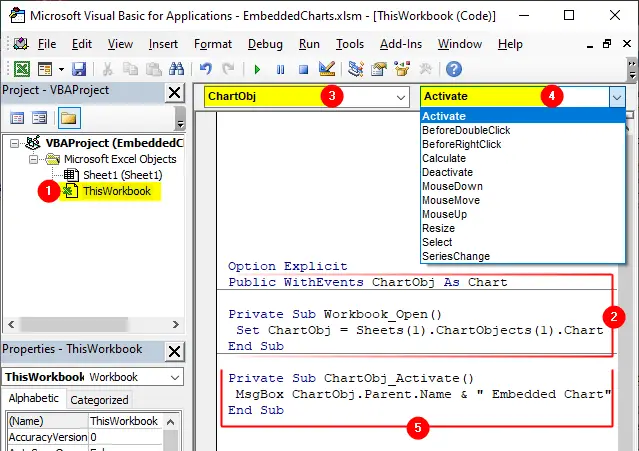
ThisWorkbookmodule:Public WithEvents ChartObj As Chart - Then write the following code to associate the
ChartObjobject with a particular chart. The following code point to the first chart on the first sheet:
Private Sub Workbook_Open()
 Set ChartObj = Sheets(1).ChartObjects(1).Chart
End Sub
After the ChartObj object has been declared, it appears in the Object drop-down box. When you select the ChartObj object in the Object box, the available events for the Chart object are listed in the Procedure drop-down box on the right:
Now you can use Chart events for any embedded chart on the workbook. You can use this code to capture events only for a single chart on a workbook. For multiple embedded charts either move them to chart sheets or create a class module, which we discuss later.