The chart text elements you can link to a cell are the chart title, the primary and secondary X-axis titles, the primary and secondary Y-axis titles, and the series data labels.
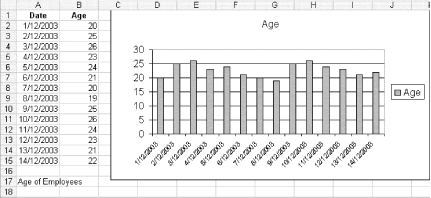
To see how this is done, you will link the title of a chart to a cell. So, to begin, set up some data such as that shown in figure and, using the Chart Wizard, create a basic clustered column chart. Now click cell A17 and type Age of Employees.
Figure. Clustered column chart with title created via Chart Wizard
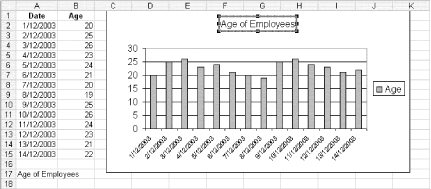
The next step is to establish a link between the chart title and the cell. So, select the chart title (Age, in this case), then go to the Formula bar, type = (an equals sign), click cell A17, and press Enter. (Note that if you are referencing a cell on another sheet, you will have to type the sheet name followed by an exclamation mark [!], then the cell reference.)
The same process works for data labels, but you need to select an individual data label before linking it to a cell. Your results should look like in figure.
Figure. Clustered column chart with title linked to cell A17
This tutorial will make your chart text elements and chart data stay in harmony. Plus, it can save you time when creating charts.