Explode a Single Slice from a Pie Chart
The default option on an exploded pie chart is to explode all the slices simultaneously and for the same distance. With a couple of mouse clicks, you can explode one slice at a time.
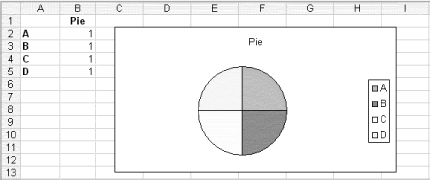
To begin, set up a basic pie chart such as the one shown in Figure 5-1.
Figure 5-1. Simple pie chart set up from worksheet data

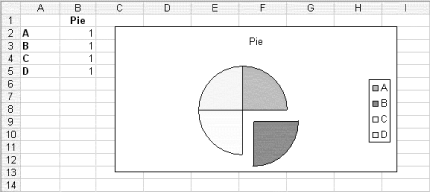
Next, click the pie chart and then slowly double-click the slice you want to explode. Drag the selected slice of pie away from the center of the chart, and you will see the exploded effect shown in Figure 5-2.
Figure 5-2. Simple pie chart with exploding slice

Dragging the single slice will leave the other slices unaffected. You can repeat this for other slices if you want. This technique also works just as well with a 3D pie. To make the pie 3D, click the chart, right-click and select Chart Type, and then select the 3D Pie icon.
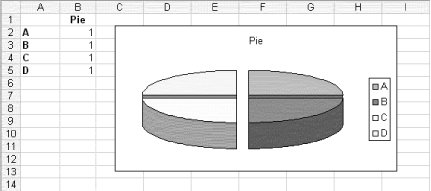
If you want to explode all the slices at the same time, simply click the pie to select it, then drag away from the center, and all the slices will have the exploded effect shown in Figure 5-3. The further you drag the slices, the smaller they will get.
Figure 5-3. 3D pie chart with exploding slices

The reverse also works if you want to "unexplode" your pie. Simply click the piece of pie and drag toward the middle to put it all back together again.
- Create Two Sets of Slices in One Pie Chart
- Create Charts That Adjust to Data
- Interact with Your Charts Using Custom Controls
- Three Quick Ways to Update Your Charts
- Simple Thermometer Chart
- Create a Column Chart with Variable Widths and Heights
- Create a Speedometer Chart
- Link Chart Text Elements to a Cell
- Cut Chart Data So That Blank Cells Are Not Plotted