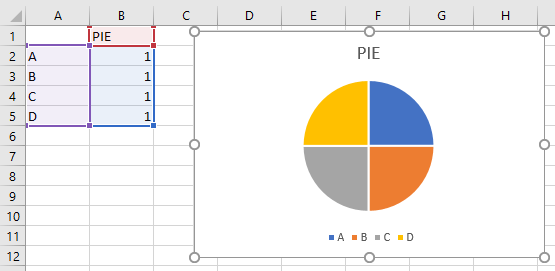
To begin, set up a basic pie chart such as the one shown in the figure:
Next, click the pie chart and then slowly double-click the slice you want to explode. Drag the selected slice of pie away from the center of the chart, and you will see the exploded effect shown in the figure:
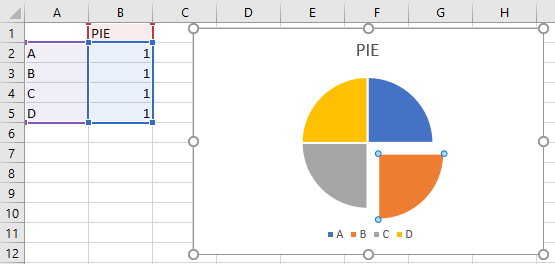
Dragging the single slice will leave the other slices unaffected. You can repeat this for other slices if you want. This technique also works just as well with a 3D pie. You can also use the Point Explosion feature to explode a single slice.
To convert the pie to 3D, click the chart, right-click and select Change Chart Type, and then select the 3D Pie icon.
If you want to explode all the slices at the same time, simply click the pie to select it, then drag away from the center, and all the slices will have the exploded effect shown in the figure below. The further you drag the slices, the smaller they will get. You can also use the Pie Explosion feature to explode all slices.
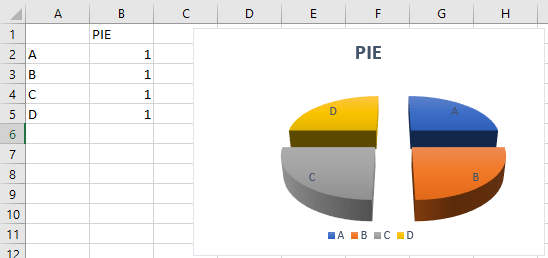
The reverse also works if you want to “unexplode” your pie. Simply click the piece of pie and drag it toward the middle to put it all back together again.
Using Point Explosion
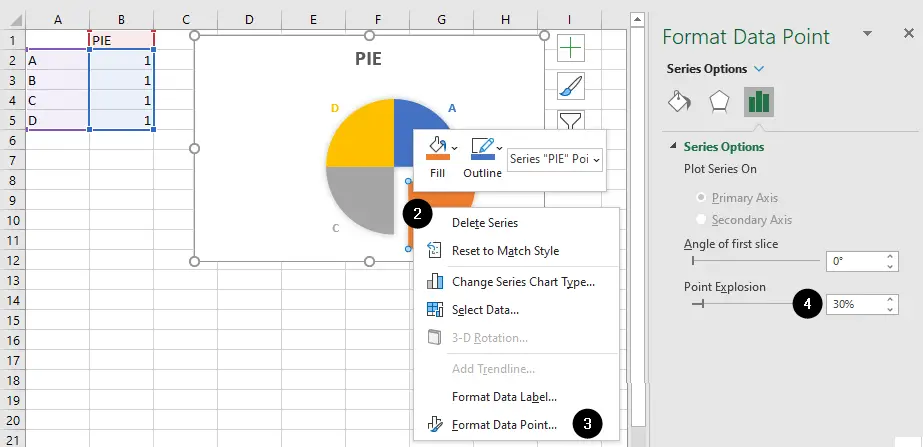
- Click the pie chart and then slowly double-click (click twice slowly) the slice you want to explode to select it.
- Right-click on the selected slice.
- Choose
Format Data Pointfrom the context menu. - In the
Format Data Pointpane that appears on the right, increase thePoint Explosionvalue to move the slice away from the center of the chart.
Using Pie Explosion
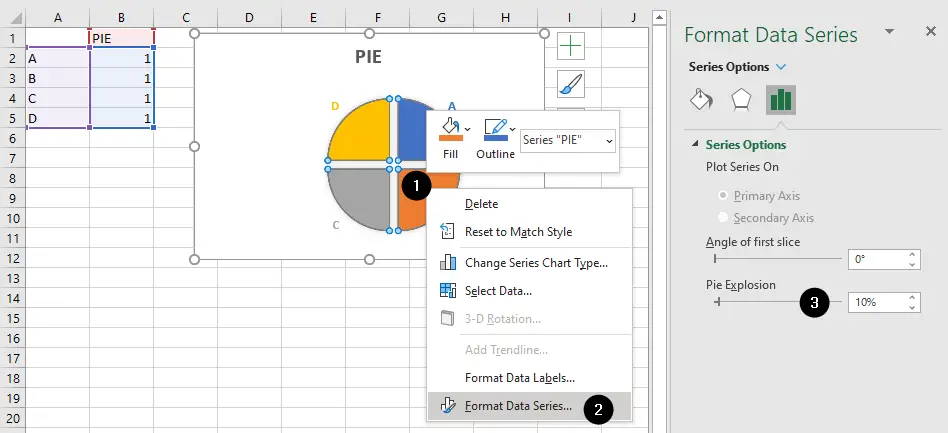
- Right-click the pie.
- Choose
Format Data Seriesfrom the context menu. - In the
Format Data Seriespane that appears on the right, increase thePie Explosionvalue to move all the slices away from the center of the chart.