Besides using cell references, you can enter explicit values, known as array constants, into your charts. To accomplish this, enclose the X and Y values within {} (curly brackets), as illustrated in the following formula:
=SERIES("My Bar",{"A","B","C","D"},{10,20,30,40},1)In the previous SERIES formula, A, B, C, and D would be the X values, while 10, 20, 30, and 40 would be their corresponding Y values.
To further illustrate, refer to the example provided below:
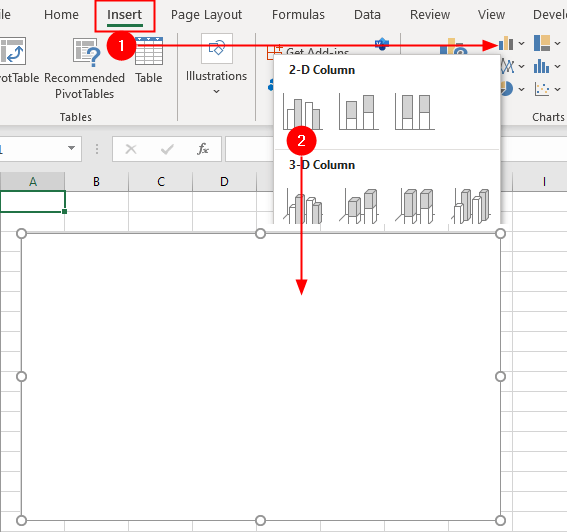
- Go to the
Inserttab, in theChartsgroup, click on the Column icon. This will display various column chart options. - Select a clustered column chart. It will insert an empty/blank chart on the sheet as shown in the figure:
- After inserting the chart, select the chart and insert the formula in the formula bar as shown in the following figure:
=SERIES("BrainBell.com",{"PHP","JS","CSS","SQL"},{1,2,3,4},1)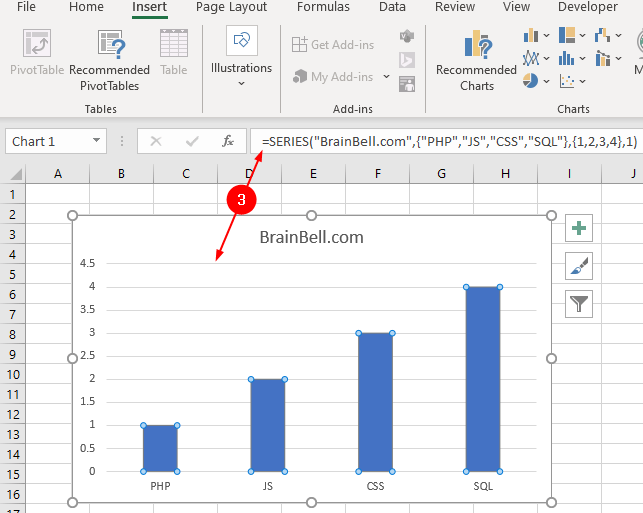
By using this method, you can create or update a chart without having to store data in cells.